TOP STORIES
CARTOONS
GOOD DEBT
PENSION CRAZY
BANKSTER PAY
MPs' 2nd JOBS
TAX IS THEFT?!
FAILING SCHOOLS
AFFORDABLE NHS
1m WORK IN POVERTY
JAIL THE ACCOUNTANTS
RICKETS IS BACK
UN-NATIONALISED RAIL
LOW WAGE BRITAIN
BANK OF MUM & DAD
UK: A PRISONER OF CUTS
TAXING LIES
WATER CANNON BORIS
UNIVERSAL C.. OCKUP
FULL TIME JOBS? WHERE!
Showing posts with label benefits. Show all posts

Monday, 6 April 2015

Monday, April 06, 2015 Posted by Jake No comments Labels: , , , ,
The LibDems and Tories squabbled over who should get credit for the increases in the personal tax free allowance (Personal Allowance), which rose from £6,475 in 2010/11 up to £10,000 in 2014/15.

Whoever did it, did it mean low paid people got to keep all their income to spend as they will? Of course not!

For people receiving Working Tax Credits, who may or may not be getting Child Tax Credits too, their tax credits are clawed back at the rate of 41 pence for every pound (i.e. a 41% withdrawal rate) above an income threshold of £6,420. Note this applies to a household's joint income rather than on an individual basis. 

As a result, people on low and moderate incomes can effectively be taxed at a marginal rate higher than those with the highest incomes.

The following examples are based on a tutorial from the ACCA (Association of Certified Chartered Accountants):
[Note, a pay increase up to £5,000 or a pay decrease up to £2,500 in one year only impacts tax credits in the following tax year].

Example 1) Alex, a single person with no children, works 40 hours per week and earned £10,000 during 2013-14.
  • In 2014-15 the maximum tax credit for Alex would be £2,740 (£1,940 basic + £800 working element)
  • Working tax credits are clawed back at the rate of 41% above an income threshold of £6,420
  • Alex earned £10,000 per annum in 2013-14, which is £3,580 above the income threshold (£10,000 - £6,420 = £3,580).
  • Alex’s tax credits are reduced by 41% of £3,580 = £1,468
  • This leaves Alex with tax credits = £2,740 - £1,468 =£1,272
What if Alex had earned an extra £1,000 in 2013-14? This affects his tax credits for the next tax year, 2014-15. Therefore for 2014-15 he would lose from this extra £1,000
o       £410 of tax credits = £1,000 x 41%
o       £200 in income tax = £1,000 x 20%
o       £120 in national insurance = £1,000 x 12%
o       Total deduction = £730
Thus Alex pays a marginal tax rate of 73%

Example 2) Zoe, a single person with two children, works 35 hours per week and earned £45,000 during 2013-14.  She pays £300 per week for child care.
  • In 2014-15 the maximum tax credit for Zoe would be £21,695
  • Working tax credits are clawed back at the rate of 41% above an income threshold of £6,420
  • Zoe earned £45,000 per annum in 2013-14, which is £38,580 (£45,000 - £6,420) above the income threshold.
  • Zoe’s tax credits are reduced by 41% of £38,580 = £15,818
  • This leaves Zoe with tax credits = £21,695 - £15,818 = £5,877
What if Zoe had earned an extra £1,000 in 2013-14?
Then in 2014-15 she would lose
o       £410 of tax credits = £1,000 x 41%
o       £400 in income tax = £1,000 x 40% (higher rate)
o       £20 in national insurance = £1,000 x 2% (NI rate 2% on earnings above £41,444 p.a.)
o       Total deduction = £830
Thus Zoe pays a marginal tax rate of 83%

In April 2015 the Financial Times' article "Million face 60% UK income tax ‘trap’" bleated about those earning over £100k paying a marginal rate of 60%, due to the progressive loss of the Personal Allowance (losing £1 of Personal Allowance for every £2 of income over £100k). 

Evidently taking 60% from the rich is more newsworthy than 73% from the poor.


SOURCE HIGH PAY CENTRE: One Law For Them - The runaway growth of executive pay
Leading economist Gavyn Davies has argued that low wage growth accounts for more than two thirds of corporate profits since the 1980s. As a substantial proportion of these profits have been used to pay dividends to shareholders, executives (who are directly paid in restricted shares) have directly increased their pay at the expense of their workers.

Saturday, 21 March 2015

Saturday, March 21, 2015 Posted by Jake No comments Labels: , , , , , , , , ,
Ripped-off Brits: pensionsDickens' fictional optimist Mr. Micawber stated the secret to his happiness was to have an income larger than his expenditure. 

Dickensian optimistic fictionalist George Osborne devised a way to dodge this restriction of income threatening to stand in the way of his happiness. 

George conceived a way to lower our incomes (low pay recovery and welfare cuts) and yet increase our household expenditure (which since 2012 has been the basis of GDP growth, and therefore the foundation of Osborne's credibility and thus his happiness).

In March 2015 the Office for National Statistics (ONS) commented "following recent trends, quarterly growth was largely driven by stronger household spending". Helped in no small extent by consumers spending the £20billion paid in compensation by the banks for their Payment Protection Insurance scam. The ONS graph below shows since 2012 household spending (labelled HHFCE and NPISH) has been the one consistent bedrock of GDP growth in the UK.


In the same month, the Office for Budget Responsibility (OBR) reported that gross household debt was heading back to levels last seen just before the 2008 banking crash. A crash which had as one of its central causes excessive household debt.


And another graph from the “Budget 2014: Background Briefing”, produced by Parliament's impartial House of Commons Library showed how consumption had been rising strongly in recent years despite falling real wages.


Osborne's big idea to get households to spend more without any more income, was that we should spend our assets!

This isn't a totally new idea. Britons have two great stores of assets: our homes and our private pensions.

In the period from 1979 up to the 2008 Banking Crash Britons were helped to withdraw and spend their housing wealth. Data from the Bank of England shows how Home Equity Withdrawal (HEW) boomed following the Tory victory in 1979, and more so in the years of the Labour government leading up to the Credit Crisis:


A report by the Centre for Research on Socio-Cultural Change (part of the University of Manchester and the Open University) observed:

"the remarkable result is that under Mrs Thatcher from 1979-90, just as under Tony Blair from 1997-2007, the real value of Housing Equity Withdrawal is larger than the real value of GDP growth"


Evidently getting Britons to spend their assets isn't new. What is new is Osborne's pension reforms. In the Queen's Speech of 2014 Her Majesty intoned Tory policy as is her duty:

"People aged 55 and over with defined contribution pensions will be able to withdraw their savings as they wish, subject to marginal rates of income tax and scheme rules. No-one will be required to buy a guaranteed lifetime annuity with their pension pot and all other existing restrictions on accessing entitlements will be lifted."
 

People with Defined Benefit (DB) pensions aren't left out, as they can convert their DB pension to a Defined Contribution and then cash it out (though giving up the advantages of a Defined Benefit pension generally makes this a terrible idea). 

We once had little option but to take our pension savings in a dribble over the course of our retirements. Osborne has now given us access to the whole pot in a dollop. The result of all this has been carefully assessed in the 2014 Budget. Tax comes from the flow of money. The HMRC graph below shows a short term tax bonanza, from people cashing in and spending their pensions. Followed by an ongoing trough from people having spent their savings and having to live on less.


Interestingly enough, here is an example where it won't be the poorest who get ripped off. ONS figures show that nearly a quarter of households have no private pension savings at all to be ripped off. Which is not surprising when you consider a report in 2014 by KPMG, the accountancy firm, that stated "The latest figure indicates that 22 percent of employees now earn less than the Living Wage". Living on less than the living wage leaves less than nothing to save in a private pension. 

With the wealthiest able to afford good advice, the juiciest targets for the scammers will be everybody in the upper middle.


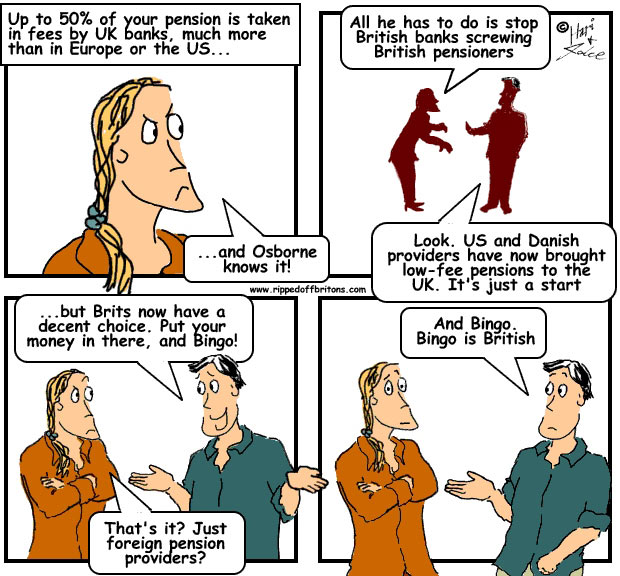
To be fair to Osborne, it's not like we weren't getting our pensions ripped off before this reform. The British pensions industry has always ripped us off with high charges and measly investment returns while we save, and with rotten annuities when we retire. David Pitt-Watson, a leading fund manager, said in evidence to Parliament

"If today, a typical young Dutch person and a typical young British person were both to save the same amount for their pension; if they were to retire on the same day, and die at the same age, the Dutch person is likely to get a pension which is at least 50% higher than the British one."

However, having been ripped off by the regulated rogues of The City of London, Osborne has opened the gates for us to be ripped off by their equally evil unregulated twins in the boiler rooms.


Following the standard "Smoking Kills" principal of useless advice, providing the government with the "We did warn you!" parachute, The Pensions Regulator provides a seven page booklet. These seven pages of large print and pictures, according to The Pensions Regulator, provide "the best possible protection against scammers".


The booklet helpfully informs you:
"Scammers don’t care whether you’re an inexperienced investor or have never put your money anywhere other than a bank. They will try to flatter, tempt and pressure you into transferring your pension fund into an investment with attractive sounding returns. Once you’ve signed the forms and the transfer has gone through, it’s too late. You’ll probably lose all your savings and end up with nothing but a hefty tax bill. Remember, the only people who benefit from scams are the scammers themselves" 

How true! And it provides a helpful graphic:

And that seven page booklet, according to The Pensions Regulator, is the "best possible protection against scammers". 

Which is probably true if the alternative is relying on regulation by the Financial Conduct Authority (FCA). Regulators in Britain, from OFGEM to the FSA and FCA, have proved to be terrible at protecting Britons from being ripped-off. You will perhaps be no worse off using the seven pages as a scammer swat.


Tuesday, 13 January 2015

Tuesday, January 13, 2015 Posted by Jake No comments Labels: , , , , , , , ,

SOURCE GUARDIAN: More than a million working households in England are in fuel poverty 
A study by the right-wing think tank Policy Exchange looking at the 2.3m households in England in fuel poverty found that half of them, around 1.1m households, had someone in work. Fuel poverty has been made worse by rising energy bills and, despite improvements, the housing stock is still highly inefficient, it said. Households in the least energy-efficient properties would have to spend an extra £1,700 a year to heat their homes to a comfortable level. The thinktank said energy efficiency should be viewed as a national infrastructure priority, tapping into the government’s £100bn infrastructure budget over the next five years. Richard Howard, the report’s author, said: “Most people assume that it’s the elderly who are most at risk of not being able to heat their homes. But the facts paint a startling picture. There are over one million working households struggling to afford their energy bills and living in underheated homes... Fuel poverty can severely affect people’s health and also puts a strain on the NHS. It is absolutely critical that the government prioritises support to those households most at risk.”


SOURCE POLICY EXCHANGE: Warmer Homes: Improving fuel poverty and energy efficiency policy in the UK
2.3 million households in England are living in fuel poverty. Over 1 million of them are in work. 10% of all households in England are in fuel poverty – but this rises to 19% of households living in private rented accommodation. Fuel poverty has been made worse by rising energy bills – consumer gas prices increased by 128% over the period 2003 to 2013. Despite some recent improvement, the UK’s housing stock remains woefully inefficient compared to other European countries. The report highlights flaws with the current fuel poverty strategy. The government target is to move all fuel poor homes in England to a ‘Band C’ energy efficiency rating by 2030, at an estimated cost of £1.2billion a year. However, the government is spending less than half of what is required (£490million a year) leading to a £700million per year funding gap.


OUR RELATED STORIES:

OECD report shows greater inequality is bad for growth

Benefits; Legal Aid; Regional Budgets; NHS; Schools; Flood Control: Ministers' "suck it and see" cuts have not first checked what the impact on the public will be, say top civil servants

Austerity? A smokescreen to change our expectations, so the 99% expect less and the 1% get more

Graphs at a glance: Britain is already a low-pay economy with falling average wages

Is your Cost of Living crisis over?! Average wages are still back where they were 10 years ago

Graphs At A Glance: NI and Income taxes make hiring costs too expensive for employers? Ours are the lowest in the EU, bar Malta, Ireland and Cyprus

Graphs at a glance: Budget 2014 document shows we’re growing through borrowing. Again. That's why Britain needs a pay rise

Saturday, 10 January 2015

Saturday, January 10, 2015 Posted by Jake 1 comment Labels: , , , , , , , ,
The main political parties try desperately to seduce supporters away from UKIP and the SNP. Famous politicians cover up their extensive blemishes, prepare their little speeches, and go out to campaign with all the insincerity of teenage Lotharios collecting kisses. They chase the national flags relentlessly. But they leave undisturbed a far larger untapped reservoir of votes: all the people who don’t vote at all. Why is that?

In the 2010 UK General Election there were seven parties that took more than 250,000 votes. 


These seven were dwarfed by the number who didn't vote at all. The most successful party in 2010, the Conservatives, took just under 11 million votes. About twice this number, 22 million, didn’t vote, comprised of:

Figures from the Electoral Commission for the 2010 General Election show the large number of MPs who owe their jobs to these voters not turning up. No MP that year had the support of more than 46% of registered voters in their own constituency.

293 MPs won their seats with the votes of fewer than 1 in 3 of their constituency's registered voters (less than 30%). 

5 of these MPs had the support of fewer than 1 in 5 of their registered voters (less than 20%). 

If the party strategists dug a little deeper into those who didn't vote in 2010 they would find a sleeping giant. However, would they actually want to wake it?

To understand why they may rather let this sleeping giant slumber take a look at results from a survey by the Hansard Society. This asked various groups how many would definitely vote at the next election:

Least likely to vote among these groups are the young, the poor, and ethnic minorities. Each of them are economically disadvantaged. 

a) The Young: A Joseph Rowntree Trust report states 70% of people under 22 are in low pay jobs.

b) Social Class "DE" includes semi and unskilled workers and those dependent on welfare. These are not only on very low incomes. According to a report commissioned by the Department of Health they also die faster! This graph, from the Marmot Report, shows the mortality rate for men aged 25 to 64 years. The graph is divided into social classes (I (highest) to V (lowest), and also divided into Employed and Unemployed:


c) Ethnic Minorities: According to a report by the Department of Works and Pensions, nearly 40% of ethnic minority households are in "relative low income". This is twice the rate for white households:
So why wouldn't the political parties want to wake up these non-voters? Sadly politics is a short-termist game. In the short-term the quickest way to give one group more is to give another group less. If the economically disadvantaged groups have removed themselves from the political process, then there is no political cost in giving them less. Something both Labour and Conservative are well aware of.

Fans of J.R.R.Tolkien's Lord of the Rings saga may remember Aragorn winning a great battle by raising the army of the dead. Aragorn successfully canvassed the ghosts with the promise of releasing them from a curse.

Will any political party have the courage to rouse the 22 million un-dead non-voters? By adopting policies that would release them from the curse of deprivation? And win the great General Election battle with their support?

We will do an analysis of non-voting by constituency pretty soon, and will link to it when it is ready. 

**Added 16th January 2015: link to online voter registration: https://www.gov.uk/register-to-vote **

Saturday, 13 December 2014

Saturday, December 13, 2014 Posted by Jake 3 comments Labels: , , , , , , ,
J.P.Morgan, in his time a successful banker, said:

“A man always has two reasons for doing anything. The good reason, and the real reason”.

Doing”: The Tory led government is squeezing benefits by freezing, cutting and capping them.

They claim “the good reason” is to push the feckless unemployed off their dependency on benefits into jobs. Make them economically productive, thereby boosting their own incomes as well as our national GDP.

Now we at Ripped-Off Britons like to think the best of people. It is just about plausible that Tory policy makers actually don’t realise that benefits go mainly to the low paid not the unemployed. Benefits are far more a subsidy to low paying employers than a subsidy to the unemployed. But for this post let’s not go there – we go there in other posts.

For now we take a closer look at whether cutting benefits actually does improve the prospects of the poor and boost Britain's GDP. The Organisation of Economic Cooperation and Development (OECD) published a report in December 2014 which provides a helpful insight.

Benefits are paid by taxes. It is a transfer of money from the richer to the poorer, and therefore reduces the income inequality gap. Office for National Statistics (ONS) figures show UK inequality is reduced by these transfers from a Gini of over 50 (like Brazil, Bolivia, Botswana) to under 35.
ONS Figures

This leaves us less unequal than the US, but more so than France and Germany:
OECD Report
The OECD report shows far from boosting economic growth, high levels of inequality have a significant negative impact:

"Drawing on harmonised data covering the OECD countries over the past 30 years, the econometric analysis suggests that income inequality has a negative and statistically significant impact on subsequent growth."

Interestingly enough, the report shows that it is precisely the people the "Good Reason" claims to be good for that are hurt most. Their graph below shows the impact of inequality on numeracy for three categories of people, based on Parental Educational Background (PEB):

  • Low PEB: Neither parent has attained upper secondary education (beyond GCSEs). The report states this constitutes about 5% of the population in the UK.
  • Medium PEB: At least one parent has gone beyond GCSE, but not continued beyond secondary school.
  • High PEB: At least one parent has attained qualifications beyond secondary school, e.g. a degree.
OECD Report
Greater inequality has no impact on the Numeracy Score for people of High PEB, and a modest negative impact on Medium PEB. But has a strong negative impact on people of Low PEB.


In terms of kids climbing up the ladder and attaining Tertiary (post secondary school) qualifications, the effect is even more startling. Higher inequality actually improves the attainment of those of Medium PEB, has no impact on those of High PEB, but is a disaster for those of Low PEB:
OECD Report
The OECD report states:
"The estimated coefficients imply that lowering bottom inequality by half of a standard deviation (which is the same as changing bottom inequality in the UK to be like that in France, or that of the US to become like that of Japan, or Australia) would increase average annual growth by nearly 0.3 percentage points over the subsequent 25-year period, with a cumulated gain in GDP at the end of the period in excess of 7 per cent."

Evidently trying to starve the poor into being rich doesn't work, neither for the poor nor for the British economy. 

So if the "Good Reason" is in fact b****s. What is the "Real Reason"?

Saturday, December 13, 2014 Posted by Hari 1 comment Labels: , , , , , , , ,
J.P.Morgan, in his time a successful banker, said:

“A man always has two reasons for doing anything. The good reason, and the real reason”.

Doing”: The Tory led government is squeezing benefits by freezing, cutting and capping them.

They claim “the good reason” is to push the feckless unemployed off their dependency on benefits into jobs. Make them economically productive, thereby boosting their own incomes as well as our national GDP.

Now we at Ripped-Off Britons like to think the best of people. It is just about plausible that Tory policy makers actually don’t realise that benefits go mainly to the low paid not the unemployed. Benefits are far more a subsidy to low paying employers than a subsidy to the unemployed. But for this post let’s not go there – we go there in other posts.

For now we take a closer look at whether cutting benefits actually does improve the prospects of the poor and boost Britain's GDP. The Organisation of Economic Cooperation and Development (OECD) published a report in December 2014 which provides a helpful insight.

Benefits are paid by taxes. It is a transfer of money from the richer to the poorer, and therefore reduces the income inequality gap. Office for National Statistics (ONS) figures show UK inequality is reduced by these transfers from a Gini of over 50 (like Brazil, Bolivia, Botswana) to under 35.


This leaves us less unequal than the US, but more so than France and Germany:

The OECD report shows far from boosting economic growth, high levels of inequality have a significant negative impact:


"Drawing on harmonised data covering the OECD countries over the past 30 years, the econometric analysis suggests that income inequality has a negative and statistically significant impact on subsequent growth."

Interestingly enough, the report shows that it is precisely the people the "Good Reason" claims to be good for that are hurt most. Their graph below shows the impact of inequality on numeracy for three categories of people, based on Parental Educational Background (PEB):

  • Low PEB: Neither parent has attained upper secondary education (beyond GCSEs). The report states this constitutes about 5% of the population in the UK.
  • Medium PEB: At least one parent has gone beyond GCSE, but not continued beyond secondary school.
  • High PEB: At least one parent has attained qualifications beyond secondary school, e.g. a degree.

Greater inequality has no impact on the Numeracy Score for people of High PEB, and a modest negative impact on Medium PEB. But has a strong negative impact on people of Low PEB.


In terms of attaining Tertiary (post secondary school) qualifications, the effect is even more startling. Higher inequality actually improves the attainment of those of Medium PEB, has no impact on those of High PEB, but is a disaster for those of Low PEB:
The OECD report states:


"The estimated coefficients imply that lowering bottom inequality by half of a standard deviation (which is the same as changing bottom inequality in the UK to be like that in France, or that of the US to become like that of Japan, or Australia) would increase average annual growth by nearly 0.3 percentage points over the subsequent 25-year period, with a cumulated gain in GDP at the end of the period in excess of 7 per cent."

Evidently trying to starve the poor into being rich doesn't work, neither for the poor nor for the British economy. 

So if the "Good Reason" is in fact b****s. What is the "Real Reason"?

Share This

Follow Us

  • Subscribe via Email

Search Us